How to Add Custom Markers, Layers, and Directions in Mapbox

Alexander Stasiak
Sep 26, 2025・12 min read
Table of Content
Imagine transforming your digital mapping projects into interactive, feature-rich applications that captivate users and deliver real-world solutions. Whether you're in logistics, real estate, or travel, harnessing the power of custom markers, layers, and directions in Mapbox can revolutionize your approach. These tools not only enhance the visual appeal of your maps but also provide critical functionality for applications like delivery tracking and route optimization.
Are you ready to explore how custom markers, layers, and directions can elevate your mapping projects to new heights?
Key Takeaways
- Custom markers and layers improve the visual and functional aspects of your maps
- The Mapbox Directions API offers route optimization for various applications
- Detailed code examples guide you through implementing these features
- Real-world use cases demonstrate the practical benefits of Mapbox features
- Setting up a Mapbox environment is crucial for accessing these tools
Setting Up Your Mapbox Environment
Before diving into Mapbox, set up your environment by creating a Mapbox account and obtaining an access token — your key to all Mapbox services. This ensures secure integration and access to APIs.
To begin:
- Create a free account on Mapbox.
- Navigate to your dashboard and generate an access token.
- Keep your token private — it authenticates every request.
You’ll integrate Mapbox into your project using Mapbox GL JS, the JavaScript library for building interactive maps.
 Example setup:
<script src="https://api.mapbox.com/mapbox-gl-js/v2.15.0/mapbox-gl.js"></script>
<link href="https://api.mapbox.com/mapbox-gl-js/v2.15.0/mapbox-gl.css" rel="stylesheet" />
<script>
mapboxgl.accessToken = 'your_mapbox_access_token';
const map = new mapboxgl.Map({
container: 'map',
style: 'mapbox://styles/mapbox/streets-v12',
center: [-74.5, 40],
zoom: 9
});
</script>
Once you’ve loaded the map, you can begin adding markers, layers, and routes.
Adding and Customizing Markers
Markers bring maps to life by visualizing key locations. You can add basic markers with GeoJSON data, or create fully custom markers using HTML and CSS.
Basic Marker Example:
new mapboxgl.Marker()
.setLngLat([-74.5, 40])
.setPopup(new mapboxgl.Popup().setHTML("<h4>New York City</h4>"))
.addTo(map);
Custom HTML Marker Example:
const el = document.createElement('div');
el.className = 'custom-marker';
el.style.backgroundImage = 'url(icon.png)';
el.style.width = '30px';
el.style.height = '30px';
new mapboxgl.Marker(el).setLngLat([-74.5, 40]).addTo(map);
💡 Tip: Use different icons or colors to categorize points — like delivery hubs, client sites, or landmarks.
Combine HTML markers with CSS animations for interactive effects.
Creating Custom Layers
Layers structure your data, letting you display multiple information types simultaneously.
Symbol Layers: for icons or labels (e.g., shops, POIs).
Circle Layers: for data clusters or density visualization.
Fill Layers: for polygons (regions, boundaries, zones).
Example – Circle Layer with GeoJSON:
map.addSource('points', {
type: 'geojson',
data: 'points.geojson'
});
map.addLayer({
id: 'circle-layer',
type: 'circle',
source: 'points',
paint: {
'circle-radius': 6,
'circle-color': '#007cbf'
}
});
💡 Pro Tip: Use lazy loading for large datasets and apply GeoJSON clustering for better performance.
Using the Directions API
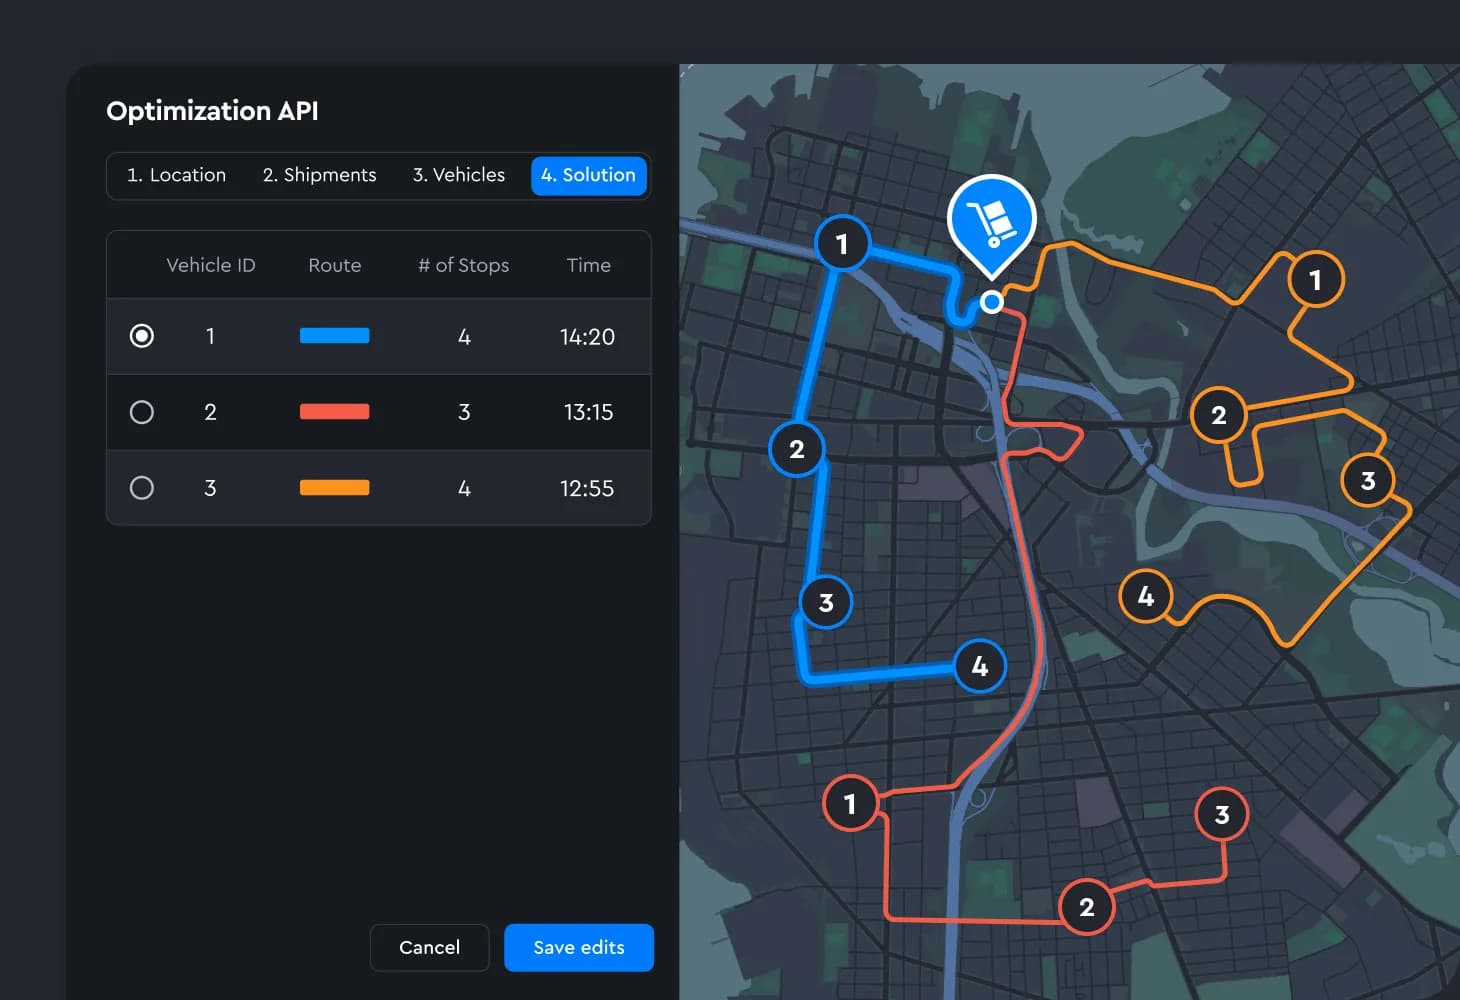
The Mapbox Directions API provides real-time routing for driving, cycling, or walking.
Example:
const directions = new MapboxDirections({
accessToken: mapboxgl.accessToken,
unit: 'metric',
profile: 'mapbox/driving'
});
map.addControl(directions, 'top-left');
This adds a user interface that calculates and displays routes dynamically.
The API returns data such as distance, duration, and turn-by-turn instructions.
Developers can use this to:
- Build logistics route planners
- Create trip or delivery visualizations
- Power mobile navigation experiences
Example Use Cases

Mapbox’s flexibility makes it a go-to platform across multiple industries that rely on geolocation, interactive maps, and real-time data visualization. Below are a few real-world examples showing how custom markers, layers, and the Directions API can drive innovation and efficiency.
🚚 Logistics and Delivery Optimization
In logistics, every second and every kilometer counts.
By integrating the Mapbox Directions API with custom markers and dynamic layers, logistics platforms can visualize delivery routes, driver positions, and traffic patterns in real time.
Example implementation:
- Use custom markers to represent delivery trucks, color-coded by route or driver.
- Apply circle layers to display delivery density or warehouse zones.
- Integrate the Directions API to calculate the shortest or fastest delivery routes based on live traffic data.
Benefits:
- Reduced travel time and fuel costs.
- Real-time visibility of fleet operations.
- Automated rerouting when traffic or delays occur.
💡 Startup House Insight:
For logistics startups, combining Mapbox with WebSocket-based data streaming or MQTT lets you push live vehicle updates directly to the user’s dashboard.
🏠 Real Estate and Property Visualization
Mapbox isn’t just for navigation — it’s a powerful tool for real estate mapping and property data visualization.
Developers can use Mapbox layers and custom markers to create interactive property maps that give buyers, investors, and agents instant spatial insights.
Example implementation:
- Use symbol layers for property categories (apartments, houses, offices).
- Add fill layers to visualize zoning, pricing areas, or district boundaries.
- Incorporate custom HTML markers that open interactive popups showing property photos, price, and contact info.
Benefits:
- Enhanced client experience through intuitive map navigation.
- Visual representation of market data trends.
- Centralized property management and filtering by location.
💡 Pro tip:
Integrating the Mapbox Geocoding API helps users search for specific addresses or neighborhoods within your property database.

✈️ Travel and Tourism Experiences
For the travel industry, Mapbox opens the door to creating interactive trip planners, smart itineraries, and custom navigation tools.
Using the Directions API, travel platforms can display multi-stop routes, attractions, and personalized recommendations based on user preferences.
Example implementation:
- Display custom markers for points of interest (museums, restaurants, landmarks).
- Use GeoJSON layers to group destinations or tourist zones.
- Enable route generation via the Directions API with multiple waypoints.
Benefits:
- Better trip planning and navigation experience for users.
- Visual storytelling through location-based itineraries.
- Integration with booking, ticketing, or hotel APIs for seamless UX.
💡 Startup House Tip:
Travel startups can combine Mapbox with OpenWeatherMap or TripAdvisor APIs to enrich maps with live weather, reviews, and local events — all visualized directly on the map.
🏙️ Urban Mobility and Smart Cities
Beyond individual industries, Mapbox also supports large-scale applications in urban mobility and smart city infrastructure.
Municipalities and tech startups can use custom layers to analyze traffic flow, public transport efficiency, or pedestrian safety.
Example implementation:
- Combine heatmap layers to visualize high-density traffic or pollution zones.
- Use line layers for public transport routes integrated with live GTFS data.
- Display markers for EV charging stations, parking zones, or bike-sharing hubs.
Benefits:
- Improved decision-making for urban planners.
- Real-time city data visualization for citizens.
- Scalable foundation for IoT-driven services and sustainability analytics.
🌍 Summing It Up
Whether you’re building a delivery management app, property portal, or travel planner, Mapbox’s custom markers, layers, and Directions API allow you to merge design with intelligence.
By visualizing data dynamically, your users don’t just see a map — they experience actionable, real-world insights.
Conclusion

Mastering Mapbox’s custom markers, layers, and Directions API gives you the power to design truly interactive, scalable mapping experiences. Whether you’re building apps for logistics, real estate, or travel, these tools help you blend functionality with design.
Want to make your product’s map smarter and faster? A certified Mapbox partner like Startup House can help you implement, optimize, and scale your integration efficiently.
How this article was made. Drafted with AI assistance, then fact-checked and edited by our team. Editorial responsibility: Startup Development House sp. z o.o. Read our AI content policy
Digital Transformation Strategy for Siemens Finance
Cloud-based platform for Siemens Financial Services in Poland


You may also like...

Mapbox vs Google Maps: Which Mapping Platform Is Better for Your App?
Choosing the right mapping platform can significantly impact your app’s success. Explore which option is the better fit for your project.
Alexander Stasiak
Nov 19, 2025・10 min read

Mapbox Enterprise Solutions: From API Integration to Custom Platforms
Integrating Mapbox into enterprise systems opens the door to interactive, scalable, and fully customizable mapping experiences. This guide reveals how developers can leverage Mapbox’s APIs, real-time data, and flexible pricing to enhance operational efficiency and deliver powerful geospatial solutions.
Alexander Stasiak
Oct 01, 2025・15 min read

Why Knowledge Base Content Becomes Outdated
Your knowledge base was a source of truth once. Now it's a liability. Products have changed, teams have restructured, and the documentation your employees and customers rely on is silently giving wrong answers.
Alexander Stasiak
Mar 17, 2026・11 min read

Introduction to the Hidden Advantage of Cursor.ai in Test Automation
As a QA tester with 5+ years of experience, I’ve seen many tools promise efficiency—but Cursor.ai truly changes the game in test automation. From repository-wide context to instant refactoring, here’s how it makes testing faster, cleaner, and more reliable.

Monika Dorula
Sep 22, 2025・10 min read

AI Agents for Factory Workflow Optimization
How autonomous agents orchestrate the whole factory — resolving bottlenecks, scheduling maintenance and reallocating resources before output suffers.
Alexander Stasiak
Sep 28, 2026・8 min read

AI Agents for Energy Management in Industrial Facilities
How autonomous agents cut industrial energy bills — peak shaving, HVAC optimisation and grid interaction, executed in real time without a human in the loop.
Alexander Stasiak
Sep 29, 2026・7 min read
Recently added

AI Agents for Clinical Documentation and Medical Administration
How ambient agents draft clinical notes, map billing codes and handle prior authorisation — giving clinicians back the hours the EHR takes away.
Alexander Stasiak
Sep 30, 2026・11 min read
AI Agents for Energy Management in Industrial Facilities
How autonomous agents cut industrial energy bills — peak shaving, HVAC optimisation and grid interaction, executed in real time without a human in the loop.
Alexander Stasiak
Sep 29, 2026・7 min read
AI Agents for Factory Workflow Optimization
How autonomous agents orchestrate the whole factory — resolving bottlenecks, scheduling maintenance and reallocating resources before output suffers.
Alexander Stasiak
Sep 28, 2026・8 min read

Application Development Solutions
Application development solutions cover the entire arc from strategic discovery to continuous scaling, and each phase has its own failure modes. This guide defines what modern solutions include, explains why discovery deserves real investment, and shows where custom engineering beats generic templates. It reviews agile sprint execution, industry-specific requirements and the engagement models that fit different growth stages. Security, compliance and time-to-market trade-offs are treated as engineering concerns rather than afterthoughts.
Alexander Stasiak
Aug 22, 2026・8 min read

Application Development In Cloud Computing
Running an application in the cloud and building it for the cloud are very different engineering decisions. This guide covers cloud-native development properly: the delivery models, the container and orchestration stack, and the CI/CD pipelines that make continuous deployment safe. It walks the lifecycle step by step, addresses the challenges teams hit around cost control and vendor lock-in, and compares long-term economics against on-premise alternatives. Industry examples and forward-looking trends round out the picture.
Alexander Stasiak
Aug 21, 2026・8 min read
Software Engineering Service
Engineering is a discipline of measurable, repeatable practice, and that is what separates a service from simple contract coding. This guide sets out the pillars of high-performance software engineering: strategic discovery, architectural design, rigorous testing and lifecycle maintenance. It compares cooperation models, explains how to choose a technology stack that suits your constraints, and walks a project from ideation to scale. A closing section looks at how AI is reshaping engineering practice itself.
Alexander Stasiak
Aug 20, 2026・7 min read
Ready to centralize your know-how with AI?
Start a new chapter in knowledge management—where the AI Assistant becomes the central pillar of your digital support experience.
Work with a team trusted by top-tier companies.


