How to Integrate Mapbox into Your React and Mobile Apps (Step-by-Step Guide)
Alexander Stasiak
Nov 18, 2025・15 min read
Table of Content
How to Integrate Mapbox into Your React and Mobile Apps (Step-by-Step Guide)
Setting Up a Mapbox Account and API Key
Integrating Mapbox in a React App
Adding Mapbox to iOS and Android Apps
Basic Map Initialization
Adding Interactive Features
Data Integration and Visualization
Using Custom Markers and Layers
Best Practices and Common Pitfalls
Security and Compliance Considerations
Testing and Deployment
Common Integration Challenges
Maintenance and Updates
Final Thoughts
Modern applications increasingly rely on interactive maps to engage users and provide location-based services. Whether you’re building a delivery app, real estate platform, or travel guide, integrating powerful mapping functionality has become essential for user experience.
Mapbox stands out as a developer-friendly mapping platform that offers extensive customization options, superior performance, and transparent pricing compared to alternatives. With support for web applications, mobile apps, and a comprehensive suite of APIs, Mapbox enables developers to create truly unique mapping experiences.
In this complete guide, you’ll learn how to integrate Mapbox into your applications, from initial account setup through advanced customization. We’ll cover React integration, mobile development for iOS and Android, best practices for performance optimization, and common pitfalls to avoid.

How to Integrate Mapbox into Your React and Mobile Apps (Step-by-Step Guide)
Successfully integrating Mapbox requires a systematic approach that ensures seamless integration across different platforms. The process involves five essential steps that form the foundation of any Mapbox implementation.
Step 1: Sign up for Mapbox account at mapbox.com and obtain access token
Creating your mapbox account takes just minutes and provides immediate access to Mapbox’s mapping capabilities. Navigate to mapbox.com and register using your email address. Once verified, you’ll gain access to the Mapbox dashboard where you can manage your projects, monitor usage, and configure API settings.
The free tier includes 50,000 monthly map loads, making it ideal for development and small-scale applications. This generous allocation allows you to experiment with features and test your integration before committing to paid plans.
Step 2: Install Mapbox SDK or library for your platform
The installation process varies depending on your target platform, but Mapbox provides native sdks and libraries for all major development environments. For React applications, you’ll install the mapbox-gl package via npm. Mobile developers can choose between native SDKs for iOS and Android, or cross-platform solutions like React Native.
Each platform offers specific optimizations and features tailored to the environment. The web SDK leverages WebGL for hardware-accelerated rendering, while mobile SDKs provide ndk support for optimal performance on resource-constrained devices.
Step 3: Initialize map with access token, container element, and basic configuration
Map initialization requires three core components: your mapbox access token, a DOM container element, and basic configuration settings. The access token authenticates your requests and links usage to your account, while the container element determines where the map appears in your application.
Configuration settings include initial center coordinates, zoom level, and map style preferences. These parameters define the user’s first impression and should align with your application’s primary use case.
Step 4: Add map to your application with styling options and interactive features
Once initialized, you can customize the map’s appearance using mapbox studio or programmatic styling. Map styles control every visual aspect, from color schemes to typography and iconography. Interactive features like navigation controls, search functionality, and user interaction handlers transform static maps into engaging user interfaces.
Consider your users’ specific needs when selecting features. Navigation apps benefit from turn-by-turn directions, while business directories require robust search and marker functionality.
Step 5: Customize with markers, layers, and data overlays
The final step involves adding custom data and interactive elements that make your map unique. Markers identify important locations, while layers visualize complex datasets using points, lines, and polygons. Data overlays enable real-time updates, showing dynamic information like traffic conditions or live vehicle tracking.
This customization phase is where Mapbox truly shines, offering unlimited flexibility to create exactly the mapping experience your application requires.
Setting Up a Mapbox Account and API Key
Before diving into development, proper account configuration ensures smooth integration and optimal security. The setup process establishes the foundation for all subsequent development work.
Creating Your Free Account
Visit mapbox.com and click the “Get started” button to begin registration. Provide your email address, create a secure password, and verify your email to activate the account. The free tier includes 50,000 monthly map loads, sufficient for most development projects and small applications.
During registration, Mapbox requests information about your intended use case. This helps them provide relevant documentation and examples, but doesn’t restrict your access to any features or APIs.
Generating Your Access Token
After successful registration, navigate to the Account Settings dashboard to generate your first access token. Access tokens authenticate API requests and control access to specific Mapbox services. The default token provides access to all core mapping features, including the Maps SDK, Geocoding API, and Directions API.
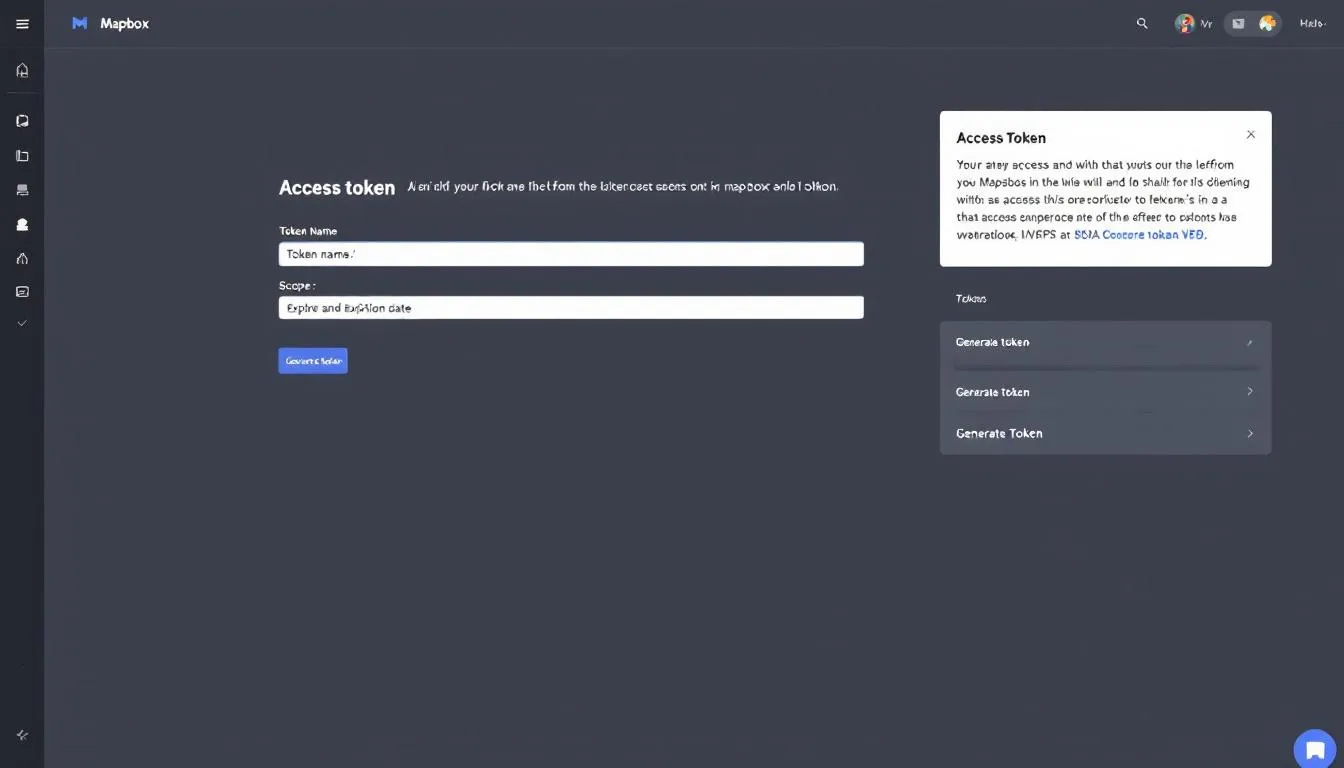
Configuring Token Security
For production applications, create restricted tokens that limit access to specific URLs and features. This security measure prevents unauthorized usage if your token is accidentally exposed. Configure URL restrictions to match your application’s domain, and enable only the APIs your application actually uses.
Store your access token securely using environment variables or secure configuration management systems. Never commit tokens directly to version control systems, as this creates security vulnerabilities and potential billing issues.
Understanding Usage Limits and Billing
Monitor your API usage through the Mapbox dashboard to understand your application’s requirements. The free tier’s 50,000 monthly map loads cover most development and testing scenarios, but production applications may require paid plans for higher volume usage.
Mapbox’s transparent pricing model charges per map load or API request, making it easy to predict costs as your application scales. Set up usage alerts to avoid unexpected charges and optimize your integration for cost efficiency.
Integrating Mapbox in a React App
React applications benefit from Mapbox’s component-based architecture and declarative programming model. The integration process leverages React’s lifecycle methods and state management for dynamic map interactions.
Installing Required Dependencies
Begin by installing the mapbox-gl package and its React wrapper:
npm install mapbox-gl
npm install react-map-gl  # Optional wrapper for easier React integration
The mapbox-gl library provides core mapping functionality, while react-map-gl offers React-specific components and utilities. Both approaches work well, with react-map-gl providing a more React-idiomatic API.
Creating Your First Map Component
Create a new React component that initializes and manages your map instance:
import React, { useRef, useEffect } from 'react';
import mapboxgl from 'mapbox-gl';

mapboxgl.accessToken = process.env.REACT_APP_MAPBOX_ACCESS_TOKEN;

const MapboxMap = () => {
  const mapContainer = useRef(null);
  const map = useRef(null);

  useEffect(() => {
    if (map.current) return; // Initialize map only once

    map.current = new mapboxgl.Map({
      container: mapContainer.current,
      style: 'mapbox://styles/mapbox/streets-v11',
      center: [-74.5, 40],
      zoom: 9
    });
  });

  return <div ref={mapContainer} className="map-container" />;
};

export default MapboxMap;
This basic implementation creates an interactive map with standard navigation controls and the default streets map style. The useRef hook maintains the map instance across component re-renders, while useEffect ensures single initialization.
Adding CSS Styling
Import Mapbox’s CSS stylesheet to ensure proper map rendering:
@import 'mapbox-gl/dist/mapbox-gl.css';

.map-container {
  width: 100%;
  height: 400px;
}
The CSS file includes essential styles for map controls, popups, and interactive elements. Without these styles, maps may appear broken or lack proper functionality.
Implementing State Management
For dynamic maps that respond to user interactions or external data, implement proper state management:
const [viewport, setViewport] = useState({
  longitude: -74.5,
  latitude: 40,
  zoom: 9
});

const [mapStyle, setMapStyle] = useState('mapbox://styles/mapbox/streets-v11');
State management enables features like synchronized views, style switching, and responsive design that adapts to different screen sizes and user preferences.
Error Handling and Loading States
Implement proper error handling for network issues, invalid tokens, or unsupported browsers:
const [mapError, setMapError] = useState(null);
const [isLoading, setIsLoading] = useState(true);

useEffect(() => {
  map.current.on('load', () => setIsLoading(false));
  map.current.on('error', (error) => setMapError(error.error.message));
}, []);
Robust error handling improves user experience and simplifies debugging during development and production deployment.
Adding Mapbox to iOS and Android Apps
Mobile integration requires platform-specific considerations for optimal performance and user experience. Both iOS and Android offer native SDKs that leverage device capabilities for smooth map interactions.
iOS Integration with Swift
For iOS applications, install the Mapbox Maps SDK using CocoaPods, Swift Package Manager, or direct framework integration. CocoaPods offers the simplest setup:
pod 'Mapbox-iOS-SDK', '~> 6.4'After installation, import MapboxMaps in your Swift files and request location permissions in your Info.plist:
<key>NSLocationWhenInUseUsageDescription</key>
<string>This app needs location access to show your position on the map.</string>
Create a basic map view controller:
import MapboxMaps

class MapViewController: UIViewController {
    override func viewDidLoad() {
        super.viewDidLoad()

        let mapView = MapView(frame: view.bounds)
        mapView.autoresizingMask = [.flexibleWidth, .flexibleHeight]

        view.addSubview(mapView)
    }
}
The iOS SDK automatically handles device orientation changes, memory management, and touch interactions optimized for iOS interface guidelines.
Android Integration with Kotlin
Android integration requires adding the Mapbox Maven repository and SDK dependency to your build.gradle file:
repositories {
    mavenCentral()
}

dependencies {
    implementation 'com.mapbox.maps:android:10.16.1'
}
Configure permissions in your AndroidManifest.xml:
<uses-permission android:name="android.permission.ACCESS_FINE_LOCATION" />
<uses-permission android:name="android.permission.ACCESS_COARSE_LOCATION" />
Initialize your map in an Activity or Fragment:
import com.mapbox.maps.MapView
import com.mapbox.maps.Style

class MainActivity : AppCompatActivity() {
    private lateinit var mapView: MapView

    override fun onCreate(savedInstanceState: Bundle?) {
        super.onCreate(savedInstanceState)
        setContentView(R.layout.activity_main)

        mapView = findViewById(R.id.mapView)
        mapView.getMapboxMap().loadStyleUri(Style.MAPBOX_STREETS)
    }
}
Cross-Platform Considerations
For applications targeting both platforms, consider using React Native or Flutter with Mapbox plugins. These frameworks provide unified APIs while maintaining access to native performance and features.
React Native Mapbox integration uses the @react-native-mapbox-gl/maps package, which wraps the native SDKs:
npm install @react-native-mapbox-gl/mapsFlutter developers can use the mapbox_gl plugin for similar cross-platform functionality:
dependencies:
  mapbox_gl: ^0.16.0
Both solutions offer excellent performance while reducing development time for multi-platform applications.
Performance Optimization for Mobile
Mobile devices require careful performance optimization to ensure smooth map interactions. Key strategies include:
- Implementing proper map lifecycle management in background/foreground transitions
- Using appropriate zoom level restrictions to limit tile requests
- Caching frequently accessed map tiles for offline usage
- Optimizing marker clustering for dense data sets
- Managing memory usage for large datasets and extended sessions
These optimizations are particularly important for devices with limited memory or slower processors, ensuring consistent performance across different hardware configurations.
Basic Map Initialization
Proper map initialization establishes the foundation for all subsequent map functionality. Understanding the core parameters and configuration options ensures optimal performance and user experience from the start.
Creating the HTML Container
Web implementations require a dedicated HTML container element with a unique ID:
<div id="map" style="width: 100%; height: 400px;"></div>The container’s dimensions determine the map’s display size, while the ID provides the reference point for JavaScript initialization. Ensure the container has explicit dimensions, as zero-height containers won’t display the map properly.
Essential Initialization Parameters
Every map instance requires four core parameters: access token, container reference, initial coordinates, and zoom level:
import mapboxgl from 'mapbox-gl';

mapboxgl.accessToken = 'YOUR_MAPBOX_ACCESS_TOKEN';

const map = new mapboxgl.Map({
  container: 'map',
  style: 'mapbox://styles/mapbox/streets-v11',
  center: [-74.006, 40.7128], // NYC coordinates [longitude, latitude]
  zoom: 12
});
The center coordinates use the longitude/latitude format, with longitude representing east-west position and latitude representing north-south position. Zoom levels range from 0 (showing the entire world) to 22 (street-level detail).
Selecting Map Styles
Mapbox provides several built-in map styles optimized for different use cases:
- streets-v11: General-purpose street map with detailed labels
- satellite-v9: High-resolution satellite imagery
- light-v10: Minimalist design for data overlay applications
- dark-v10: Dark theme suitable for night mode interfaces
- outdoors-v11: Topographic style for outdoor activities
Choose styles based on your application’s primary function. Data visualization apps benefit from light or dark styles that don’t compete with overlayed information, while navigation apps work better with detailed street styles.
Configuring User Interactions
Control user interaction capabilities through initialization options:
const map = new mapboxgl.Map({
  container: 'map',
  style: 'mapbox://styles/mapbox/streets-v11',
  center: [-74.006, 40.7128],
  zoom: 12,
  interactive: true,
  scrollZoom: true,
  dragPan: true,
  dragRotate: true,
  doubleClickZoom: true,
  touchZoomRotate: true
});
Disable specific interactions for specialized use cases. Read-only maps for displaying static information should disable all interaction options, while mobile-optimized maps might disable dragRotate to prevent accidental orientation changes.
Adding Navigation Controls
Standard navigation controls improve user experience by providing familiar interaction patterns:
map.addControl(new mapboxgl.NavigationControl());
map.addControl(new mapboxgl.FullscreenControl());
map.addControl(new mapboxgl.GeolocateControl({
  positionOptions: {
    enableHighAccuracy: true
  },
  trackUserLocation: true
}));
Position controls using the control’s position parameter: ‘top-left’, ‘top-right’, ‘bottom-left’, or ‘bottom-right’. Consider your interface layout when selecting positions to avoid conflicts with other UI elements.

Adding Interactive Features
Interactive features transform static maps into engaging user interfaces that respond to user actions and display dynamic information. These features form the core of most mapping applications.
Implementing Custom Markers
Markers identify specific locations and provide entry points for additional information:
// Create a simple marker
const marker = new mapboxgl.Marker()
  .setLngLat([-74.006, 40.7128])
  .addTo(map);

// Create a custom marker with HTML content
const el = document.createElement('div');
el.className = 'custom-marker';
el.innerHTML = '<i class="fas fa-map-marker-alt"></i>';

const customMarker = new mapboxgl.Marker(el)
  .setLngLat([-74.006, 40.7128])
  .addTo(map);
Custom markers allow complete control over appearance, supporting HTML elements, CSS styling, and JavaScript event handlers. Use custom markers to match your application’s design system and provide visual hierarchy for different marker types.
Creating Interactive Popups
Popups display contextual information when users interact with markers or map features:
const popup = new mapboxgl.Popup({ offset: 25 })
  .setLngLat([-74.006, 40.7128])
  .setHTML('<h3>Location Title</h3><p>Detailed information about this location.</p>')
  .addTo(map);

// Attach popup to marker
marker.setPopup(popup);
Design popup content to provide value without overwhelming users. Include essential information like names, addresses, and primary actions, while linking to detailed views for comprehensive information.
Handling Click and Hover Events
Event handlers enable dynamic responses to user interactions:
// Handle map clicks
map.on('click', (e) => {
  const coordinates = e.lngLat;
  console.log(`Clicked at: ${coordinates.lng}, ${coordinates.lat}`);

  new mapboxgl.Popup()
    .setLngLat(coordinates)
    .setHTML(`<p>Coordinates: ${coordinates.lng.toFixed(4)}, ${coordinates.lat.toFixed(4)}</p>`)
    .addTo(map);
});

// Handle feature hover
map.on('mouseenter', 'poi-layer', () => {
  map.getCanvas().style.cursor = 'pointer';
});

map.on('mouseleave', 'poi-layer', () => {
  map.getCanvas().style.cursor = '';
});
Implement appropriate feedback for all interactive elements. Visual feedback like cursor changes and hover states help users understand which elements are clickable and improve overall usability.
Integrating Geocoding Search
The Mapbox Geocoding API enables address search with autocomplete suggestions:
import MapboxGeocoder from '@mapbox/mapbox-gl-geocoder';

map.addControl(
  new MapboxGeocoder({
    accessToken: mapboxgl.accessToken,
    mapboxgl: mapboxgl,
    placeholder: 'Search for places',
    bbox: [-74.5, 40.5, -73.5, 40.9], // Limit search to specific area
    proximity: [-74.006, 40.7128] // Bias results towards this location
  })
);
Configure geocoding to match your application’s geographic scope. Local business directories should use bbox parameters to limit results to relevant areas, while global applications can omit geographic restrictions.
Implementing Route Planning
The Directions API provides routing capabilities for navigation and trip planning:
// Request route between two points
async function getRoute(start, end) {
  const query = await fetch(
    `https://api.mapbox.com/directions/v5/mapbox/driving/${start[0]},${start[1]};${end[0]},${end[1]}?steps=true&geometries=geojson&access_token=${mapboxgl.accessToken}`
  );

  const json = await query.json();
  const route = json.routes[0];

  // Add route to map
  map.addSource('route', {
    type: 'geojson',
    data: {
      type: 'Feature',
      properties: {},
      geometry: route.geometry
    }
  });

  map.addLayer({
    id: 'route',
    type: 'line',
    source: 'route',
    layout: {
      'line-join': 'round',
      'line-cap': 'round'
    },
    paint: {
      'line-color': '#3887be',
      'line-width': 5,
      'line-opacity': 0.75
    }
  });
}
Route visualization should clearly distinguish between different route options and highlight important waypoints or turn instructions. Consider traffic conditions and real-time updates for navigation applications.
Data Integration and Visualization
Effective data integration transforms maps from simple navigation tools into powerful visualization platforms. Understanding data formats, layer management, and real-time updates enables sophisticated mapping applications.
Working with GeoJSON Data
GeoJSON provides a standardized format for encoding geographic data structures:
const customData = {
  type: 'FeatureCollection',
  features: [
    {
      type: 'Feature',
      geometry: {
        type: 'Point',
        coordinates: [-74.006, 40.7128]
      },
      properties: {
        title: 'New York City',
        description: 'The most populous city in the United States.',
        category: 'major-city'
      }
    }
  ]
};

// Add data source to map
map.addSource('custom-data', {
  type: 'geojson',
  data: customData
});
Structure GeoJSON data to include relevant properties for styling and interaction. Properties drive data-driven styling, popup content, and filtering capabilities.
Creating Vector Layers
Vector layers provide scalable rendering for large datasets:
// Add a layer for points
map.addLayer({
  id: 'custom-points',
  type: 'circle',
  source: 'custom-data',
  paint: {
    'circle-radius': 6,
    'circle-color': [
      'match',
      ['get', 'category'],
      'major-city', '#ff6b6b',
      'town', '#4ecdc4',
      '#ccc' // fallback color
    ]
  }
});

// Add a layer for labels
map.addLayer({
  id: 'custom-labels',
  type: 'symbol',
  source: 'custom-data',
  layout: {
    'text-field': ['get', 'title'],
    'text-font': ['Open Sans Semibold', 'Arial Unicode MS Bold'],
    'text-offset': [0, 1.25],
    'text-anchor': 'top'
  }
});
Layer ordering determines visual hierarchy, with later layers rendering on top. Use appropriate layer types (circle, line, fill, symbol) based on your data structure and visualization requirements.
Implementing Real-Time Updates
Real-time data updates enable live tracking and dynamic visualization:
// Update data source with new information
function updateLiveData(newData) {
  map.getSource('live-data').setData(newData);
}

// WebSocket connection for real-time updates
const ws = new WebSocket('wss://your-websocket-server.com');
ws.onmessage = (event) => {
  const data = JSON.parse(event.data);
  updateLiveData(data);
};

// Feature state updates for individual features
map.setFeatureState(
  { source: 'live-data', id: 'feature-1' },
  { active: true, value: 42 }
);
Real-time updates should balance frequency with performance. High-frequency updates can overwhelm rendering capabilities, while sparse updates may miss important changes. Implement appropriate throttling and buffering strategies.
Data Clustering for Performance
Clustering improves performance and readability for dense datasets:
map.addSource('clustered-data', {
  type: 'geojson',
  data: largeDataset,
  cluster: true,
  clusterMaxZoom: 14,
  clusterRadius: 50
});

// Cluster circles
map.addLayer({
  id: 'clusters',
  type: 'circle',
  source: 'clustered-data',
  filter: ['has', 'point_count'],
  paint: {
    'circle-color': [
      'step',
      ['get', 'point_count'],
      '#51bbd6',
      100, '#f1f075',
      750, '#f28cb1'
    ],
    'circle-radius': [
      'step',
      ['get', 'point_count'],
      20, 100, 30, 750, 40
    ]
  }
});
Configure clustering parameters based on your data density and zoom level requirements. Aggressive clustering improves performance but may hide important geographic patterns.

Using Custom Markers and Layers
Advanced customization capabilities distinguish professional mapping applications from basic implementations. Custom markers and layers provide unlimited flexibility for creating unique visual experiences.
Advanced Marker Customization
Create sophisticated custom markers that adapt to different states and interactions:
class CustomMarker {
  constructor(coordinates, properties) {
    this.coordinates = coordinates;
    this.properties = properties;
    this.element = this.createElement();
    this.marker = new mapboxgl.Marker(this.element)
      .setLngLat(coordinates);
  }

  createElement() {
    const el = document.createElement('div');
    el.className = `custom-marker ${this.properties.category}`;

    el.innerHTML = `
      <div class="marker-content">
        <div class="marker-icon">${this.properties.icon}</div>
        <div class="marker-label">${this.properties.label}</div>
      </div>
    `;

    el.addEventListener('click', () => this.handleClick());
    el.addEventListener('mouseenter', () => this.handleHover(true));
    el.addEventListener('mouseleave', () => this.handleHover(false));

    return el;
  }

  handleClick() {
    // Custom click behavior
    this.element.classList.toggle('active');
  }

  handleHover(isHovering) {
    this.element.classList.toggle('hover', isHovering);
  }

  addTo(map) {
    this.marker.addTo(map);
    return this;
  }
}
Custom marker classes enable consistent behavior across multiple marker instances while providing flexibility for unique requirements.
Creating 3D Visualizations
Mapbox supports 3D terrain and building extrusions for enhanced visual impact:
// Enable 3D terrain
map.on('style.load', () => {
  map.addSource('mapbox-dem', {
    type: 'raster-dem',
    url: 'mapbox://mapbox.mapbox-terrain-dem-v1',
    tileSize: 512,
    maxzoom: 14
  });

  map.setTerrain({ source: 'mapbox-dem', exaggeration: 1.5 });

  // Add 3D buildings
  map.addLayer({
    id: '3d-buildings',
    source: 'composite',
    'source-layer': 'building',
    filter: ['==', 'extrude', 'true'],
    type: 'fill-extrusion',
    minzoom: 15,
    paint: {
      'fill-extrusion-color': '#aaa',
      'fill-extrusion-height': [
        'interpolate',
        ['linear'],
        ['zoom'],
        15, 0,
        15.05, ['get', 'height']
      ],
      'fill-extrusion-base': [
        'interpolate',
        ['linear'],
        ['zoom'],
        15, 0,
        15.05, ['get', 'min_height']
      ],
      'fill-extrusion-opacity': 0.6
    }
  });
});
3D visualizations work best for urban environments and architectural applications. Consider performance implications for mobile devices and older hardware.
Custom Style Development
Mapbox Studio enables comprehensive style customization through visual editing:
- Create a new style in Mapbox Studio
- Customize colors, typography, and iconography
- Configure layer visibility and styling rules
- Test across different zoom levels and regions
- Publish and integrate into applications
Programmatic style modifications enable dynamic styling based on user preferences or application state:
// Change building colors based on data
map.setPaintProperty('buildings', 'fill-color', [
  'case',
  ['>', ['get', 'height'], 100], '#ff6b6b',
  ['>', ['get', 'height'], 50], '#ffa726',
  '#66bb6a'
]);

// Toggle layer visibility
map.setLayoutProperty('satellite', 'visibility', 'visible');
map.setLayoutProperty('streets', 'visibility', 'none');
Dynamic Layer Management
Effective layer management enables complex visualizations without overwhelming users:
class LayerManager {
  constructor(map) {
    this.map = map;
    this.layers = new Map();
    this.layerOrder = [];
  }

  addLayer(id, layer, beforeId = null) {
    if (this.layers.has(id)) {
      this.removeLayer(id);
    }

    this.map.addLayer(layer, beforeId);
    this.layers.set(id, layer);

    if (beforeId) {
      const beforeIndex = this.layerOrder.indexOf(beforeId);
      this.layerOrder.splice(beforeIndex, 0, id);
    } else {
      this.layerOrder.push(id);
    }
  }

  removeLayer(id) {
    if (this.layers.has(id)) {
      this.map.removeLayer(id);
      this.layers.delete(id);
      this.layerOrder = this.layerOrder.filter(layerId => layerId !== id);
    }
  }

  toggleLayer(id, visible) {
    if (this.layers.has(id)) {
      this.map.setLayoutProperty(id, 'visibility', visible ? 'visible' : 'none');
    }
  }

  reorderLayer(id, newPosition) {
    // Implementation for layer reordering
  }
}
Centralized layer management simplifies complex applications with multiple data sources and visualization modes.
Best Practices and Common Pitfalls
Successful Mapbox integration requires attention to performance, security, and user experience considerations. Understanding common pitfalls helps avoid issues that can compromise application quality.
Performance Optimization Strategies
Optimize map performance through careful resource management and rendering strategies:
// Implement proper cleanup
map.on('remove', () => {
  // Clean up event listeners
  map.off('click', clickHandler);
  map.off('mousemove', mouseMoveHandler);

  // Remove sources and layers
  if (map.getLayer('custom-layer')) {
    map.removeLayer('custom-layer');
  }
  if (map.getSource('custom-source')) {
    map.removeSource('custom-source');
  }
});

// Use feature-state for dynamic styling
map.on('click', 'data-layer', (e) => {
  map.setFeatureState(
    { source: 'data-source', id: e.features[0].id },
    { clicked: true }
  );
});
Implement lazy loading for large datasets and use appropriate zoom level restrictions to minimize unnecessary tile requests. Vector tiles provide better performance than raster alternatives for most use cases.
Security Best Practices
Protect your access tokens and implement proper authentication:
// Use environment variables for tokens
const accessToken = process.env.REACT_APP_MAPBOX_ACCESS_TOKEN;

// Implement token restrictions in Mapbox dashboard
// - URL restrictions for web applications
// - Bundle ID restrictions for mobile apps
// - API scope limitations

// Client-side token validation
if (!accessToken || accessToken.startsWith('pk.')) {
  console.error('Invalid Mapbox access token');
}
Never expose secret access tokens in client-side code. Use public tokens with appropriate URL restrictions for web applications and implement server-side proxies for sensitive operations.
Error Handling and Fallbacks
Implement comprehensive error handling for network issues and browser compatibility:
// Handle map load errors
map.on('error', (e) => {
  console.error('Map error:', e.error);

  // Implement fallback behavior
  if (e.error.status === 401) {
    showErrorMessage('Invalid access token. Please check your configuration.');
  } else if (e.error.status === 429) {
    showErrorMessage('Rate limit exceeded. Please try again later.');
  } else {
    showErrorMessage('Map failed to load. Please refresh the page.');
  }
});

// Check WebGL support
if (!mapboxgl.supported()) {
  showErrorMessage('Your browser does not support Mapbox GL JS.');
}
Provide meaningful error messages and fallback options when maps fail to load. Consider implementing progressive enhancement for users with limited browser support.
Mobile-Specific Considerations
Optimize mobile experiences through responsive design and performance tuning:
// Implement responsive map sizing
function resizeMap() {
  const isMobile = window.innerWidth < 768;

  map.resize();

  // Adjust controls for mobile
  if (isMobile) {
    map.getContainer().style.height = '60vh';
    // Hide complex controls on mobile
    map.removeControl(fullscreenControl);
  }
}

window.addEventListener('resize', resizeMap);
window.addEventListener('orientationchange', () => {
  setTimeout(resizeMap, 500);
});
Consider touch interaction patterns, device orientation changes, and battery life when designing mobile mapping experiences.
Memory Management
Prevent memory leaks through proper resource cleanup:
// Clean up large datasets
function updateData(newData) {
  // Remove existing data
  if (map.getSource('large-dataset')) {
    map.removeLayer('large-dataset-layer');
    map.removeSource('large-dataset');
  }

  // Add new data
  map.addSource('large-dataset', {
    type: 'geojson',
    data: newData
  });

  map.addLayer({
    id: 'large-dataset-layer',
    type: 'circle',
    source: 'large-dataset'
  });
}

// Implement data pagination for large datasets
function loadDataChunk(bounds, zoom) {
  if (zoom > 12) {
    // Load detailed data only at high zoom levels
    loadDetailedData(bounds);
  } else {
    // Load simplified data for overview
    loadSimplifiedData(bounds);
  }
}
Monitor memory usage and implement appropriate data pagination strategies for applications handling large datasets.
Security and Compliance Considerations
Mapping applications often handle sensitive location data, requiring careful attention to security and regulatory compliance. Implementing proper safeguards protects both users and organizations.
Access Token Security
Implement robust token management practices:
// Environment-based token management
const getAccessToken = () => {
  const token = process.env.REACT_APP_MAPBOX_ACCESS_TOKEN;

  if (!token) {
    throw new Error('Mapbox access token not found');
  }

  if (!token.startsWith('pk.')) {
    console.warn('Using non-public access token in client-side code');
  }

  return token;
};

// Server-side proxy for sensitive operations
const geocodeAddress = async (address) => {
  const response = await fetch('/api/geocode', {
    method: 'POST',
    headers: { 'Content-Type': 'application/json' },
    body: JSON.stringify({ address })
  });

  return response.json();
};
Use public access tokens for client-side applications and implement server-side proxies for operations requiring secret tokens.
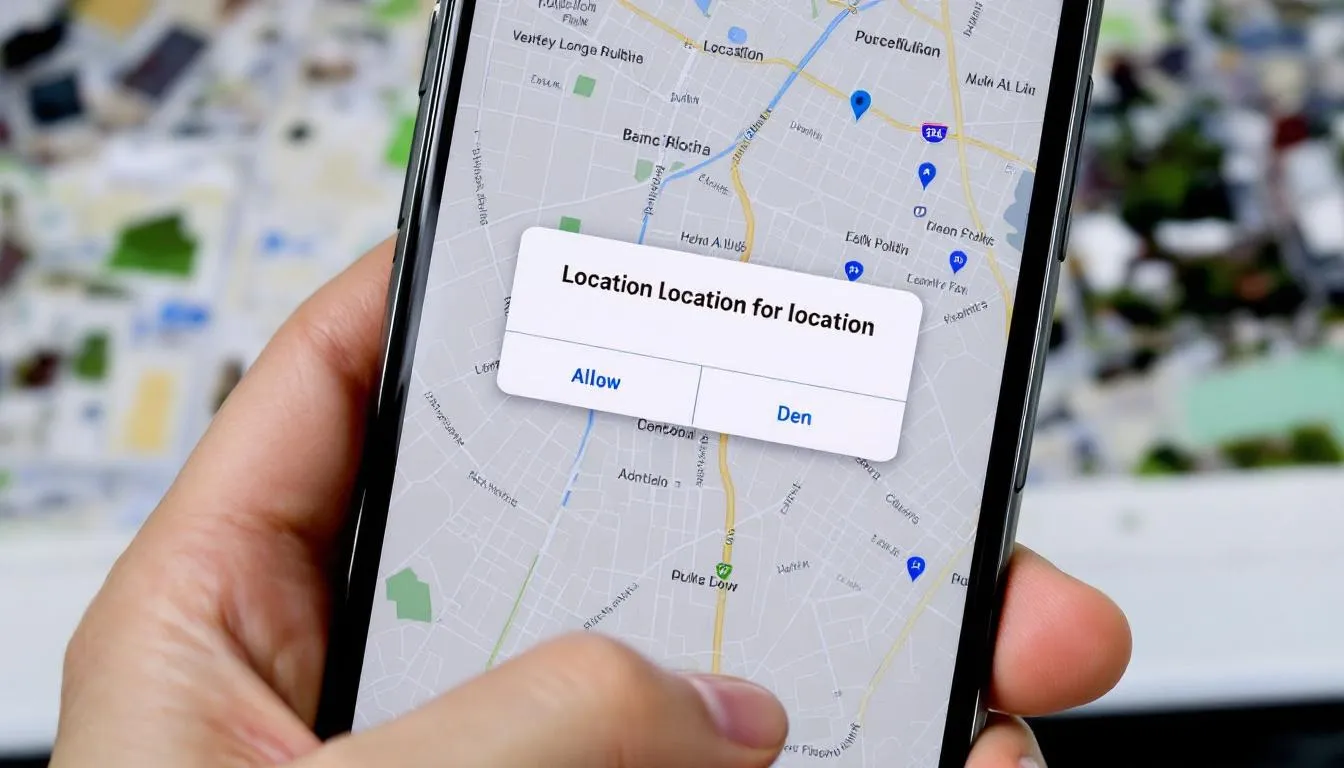
Privacy and Data Protection
Implement user consent mechanisms and data protection measures:
// Request location permission with clear explanation
const requestLocationPermission = async () => {
  if ('geolocation' in navigator) {
    const permission = await navigator.permissions.query({ name: 'geolocation' });

    if (permission.state === 'prompt') {
      showLocationConsentDialog();
    } else if (permission.state === 'granted') {
      enableLocationFeatures();
    }
  }
};

// Disable telemetry data collection
mapboxgl.prewarm();
mapboxgl.clearPrewarmedResources();

// Implement data anonymization
const anonymizeLocationData = (coordinates) => {
  // Reduce precision for privacy
  return coordinates.map(coord => Math.round(coord * 1000) / 1000);
};
GDPR Compliance
Ensure compliance with European privacy regulations:
// Cookie consent integration
const initializeMapWithConsent = () => {
  if (hasUserConsent('location')) {
    // Initialize full map functionality
    initializeMap();
    enableLocationServices();
  } else {
    // Initialize limited functionality
    initializeBasicMap();
    showConsentBanner();
  }
};

// Data retention policies
const scheduleDataCleanup = () => {
  setInterval(() => {
    cleanupOldLocationData();
  }, 24 * 60 * 60 * 1000); // Daily cleanup
};
Attribution Requirements
Ensure proper attribution and licensing compliance:
/* Mapbox attribution must remain visible */
.mapboxgl-ctrl-attrib {
  display: block !important;
}

/* Custom attribution for additional data sources */
.custom-attribution {
  position: absolute;
  bottom: 0;
  right: 0;
  background: rgba(255, 255, 255, 0.8);
  padding: 2px 5px;
  font-size: 11px;
}
Display required attribution for all data sources and respect licensing terms for custom datasets.
Testing and Deployment
Thorough testing ensures reliable map functionality across different environments and user scenarios. Implementing proper monitoring and deployment practices prevents production issues.
Cross-Browser Testing
Test map functionality across different browsers and devices:
// Feature detection and fallbacks
const initializeMap = () => {
  if (!mapboxgl.supported()) {
    // Fallback for unsupported browsers
    loadStaticMapFallback();
    return;
  }

  // Check for required APIs
  if (!('geolocation' in navigator)) {
    disableLocationFeatures();
  }

  // Progressive enhancement
  if (window.matchMedia('(max-width: 768px)').matches) {
    initializeMobileOptimizedMap();
  } else {
    initializeDesktopMap();
  }
};

// Performance monitoring
const trackMapPerformance = () => {
  const startTime = performance.now();

  map.on('load', () => {
    const loadTime = performance.now() - startTime;
    analytics.track('map_load_time', { duration: loadTime });
  });
};
Load Testing and Performance Monitoring
Monitor application performance under various load conditions:
// API usage monitoring
const monitorAPIUsage = () => {
  let requestCount = 0;

  const originalFetch = window.fetch;
  window.fetch = function(...args) {
    if (args[0].includes('mapbox.com')) {
      requestCount++;
      console.log(`Mapbox API requests: ${requestCount}`);
    }
    return originalFetch.apply(this, args);
  };
};

// Memory usage tracking
const trackMemoryUsage = () => {
  if (performance.memory) {
    setInterval(() => {
      const usage = {
        used: performance.memory.usedJSHeapSize,
        total: performance.memory.totalJSHeapSize,
        limit: performance.memory.jsHeapSizeLimit
      };

      if (usage.used / usage.limit > 0.8) {
        console.warn('High memory usage detected');
      }
    }, 30000);
  }
};
Production Deployment Configuration
Configure production environments for optimal performance and monitoring:
// Production environment detection
const isProd = process.env.NODE_ENV === 'production';

const mapConfig = {
  container: 'map',
  style: isProd
    ? 'mapbox://styles/your-username/production-style'
    : 'mapbox://styles/mapbox/streets-v11',
  center: [-74.006, 40.7128],
  zoom: 12,
  // Disable debug features in production
  debug: !isProd,
  // Enable performance monitoring
  collectResourceTiming: isProd
};

// Error reporting integration
map.on('error', (error) => {
  if (isProd) {
    errorReporting.captureException(error);
  } else {
    console.error('Map error:', error);
  }
});
Automated Testing Strategies
Implement automated tests for critical map functionality:
// Unit tests for map utilities
describe('MapUtils', () => {
  test('calculates distance between coordinates', () => {
    const distance = MapUtils.calculateDistance(
      [-74.006, 40.7128], // NYC
      [-118.2437, 34.0522] // LA
    );
    expect(distance).toBeCloseTo(3944, 0); // kilometers
  });

  test('validates coordinate format', () => {
    expect(MapUtils.isValidCoordinate([-74.006, 40.7128])).toBe(true);
    expect(MapUtils.isValidCoordinate([200, 40.7128])).toBe(false);
  });
});

// Integration tests for map interactions
describe('Map Integration', () => {
  let map;

  beforeEach(() => {
    map = new mapboxgl.Map({
      container: document.createElement('div'),
      style: 'mapbox://styles/mapbox/streets-v11',
      center: [0, 0],
      zoom: 1
    });
  });

  test('adds markers successfully', (done) => {
    const marker = new mapboxgl.Marker()
      .setLngLat([0, 0])
      .addTo(map);

    map.on('load', () => {
      expect(marker.getLngLat()).toEqual({ lng: 0, lat: 0 });
      done();
    });
  });
});
Common Integration Challenges
Understanding common challenges helps developers avoid frustration and implement robust solutions from the start. These issues represent frequent stumbling blocks in Mapbox integration projects.
Rate Limiting and Quota Management
Implement proper rate limiting and quota monitoring:
// Request throttling for high-frequency operations
class RequestThrottler {
  constructor(requestsPerSecond = 10) {
    this.queue = [];
    this.processing = false;
    this.interval = 1000 / requestsPerSecond;
  }

  async throttledRequest(url, options = {}) {
    return new Promise((resolve, reject) => {
      this.queue.push({ url, options, resolve, reject });
      this.processQueue();
    });
  }

  async processQueue() {
    if (this.processing || this.queue.length === 0) return;

    this.processing = true;

    while (this.queue.length > 0) {
      const request = this.queue.shift();

      try {
        const response = await fetch(request.url, request.options);
        request.resolve(response);
      } catch (error) {
        request.reject(error);
      }

      await new Promise(resolve => setTimeout(resolve, this.interval));
    }

    this.processing = false;
  }
}

// Usage monitoring and alerts
const usageMonitor = {
  requests: 0,
  startTime: Date.now(),

  trackRequest() {
    this.requests++;

    const elapsed = Date.now() - this.startTime;
    const requestsPerHour = (this.requests / elapsed) * 3600000;

    if (requestsPerHour > 50000) { // Approaching free tier limit
      console.warn('High API usage detected');
      // Implement usage reduction strategies
    }
  }
};
Coordinate System Conflicts
Handle coordinate system differences between data sources:
// Coordinate transformation utilities
class CoordinateTransformer {
  // Convert from Web Mercator to WGS84
  static webMercatorToWGS84(x, y) {
    const lon = (x * 180) / 20037508.34;
    let lat = (y * 180) / 20037508.34;
    lat = (Math.atan(Math.exp(lat * (Math.PI / 180))) * 360) / Math.PI - 90;
    return [lon, lat];
  }

  // Validate coordinate ranges
  static isValidWGS84(coordinates) {
    const [lon, lat] = coordinates;
    return lon >= -180 && lon <= 180 && lat >= -90 && lat <= 90;
  }

  // Handle coordinate precision issues
  static normalizeCoordinates(coordinates, precision = 6) {
    return coordinates.map(coord =>
      Math.round(coord * Math.pow(10, precision)) / Math.pow(10, precision)
    );
  }
}

// Data validation before adding to map
const validateAndAddData = (geojsonData) => {
  const validatedFeatures = geojsonData.features.filter(feature => {
    const coords = feature.geometry.coordinates;

    if (feature.geometry.type === 'Point') {
      return CoordinateTransformer.isValidWGS84(coords);
    }

    // Handle other geometry types...
    return true;
  });

  map.addSource('validated-data', {
    type: 'geojson',
    data: {
      type: 'FeatureCollection',
      features: validatedFeatures
    }
  });
};
WebGL and Browser Compatibility
Address rendering issues and browser compatibility:
// Comprehensive browser support detection
const BrowserSupport = {
  checkWebGL() {
    try {
      const canvas = document.createElement('canvas');
      const gl = canvas.getContext('webgl') || canvas.getContext('experimental-webgl');
      return !!gl;
    } catch (e) {
      return false;
    }
  },

  checkRequiredFeatures() {
    const features = {
      webgl: this.checkWebGL(),
      geolocation: 'geolocation' in navigator,
      localStorage: 'localStorage' in window,
      requestAnimationFrame: 'requestAnimationFrame' in window
    };

    return features;
  },

  generateFallbackOptions(features) {
    const fallbacks = [];

    if (!features.webgl) {
      fallbacks.push('WebGL not supported - using raster tiles');
    }

    if (!features.geolocation) {
      fallbacks.push('Geolocation unavailable - manual location entry required');
    }

    return fallbacks;
  }
};

// Graceful degradation implementation
const initializeMapWithFallbacks = () => {
  const support = BrowserSupport.checkRequiredFeatures();
  const fallbacks = BrowserSupport.generateFallbackOptions(support);

  if (fallbacks.length > 0) {
    console.warn('Browser limitations detected:', fallbacks);
    // Implement simplified map experience
    initializeBasicMap();
  } else {
    // Full feature implementation
    initializeAdvancedMap();
  }
};
Memory Optimization for Large Datasets
Implement efficient memory management strategies:
// Virtual scrolling for large marker sets
class MarkerManager {
  constructor(map, markers) {
    this.map = map;
    this.allMarkers = markers;
    this.visibleMarkers = new Map();
    this.viewportPadding = 0.1; // 10% padding around viewport
  }

  updateVisibleMarkers() {
    const bounds = this.map.getBounds();
    const paddedBounds = this.addPadding(bounds, this.viewportPadding);

    // Remove markers outside viewport
    this.visibleMarkers.forEach((marker, id) => {
      if (!paddedBounds.contains(marker.getLngLat())) {
        marker.remove();
        this.visibleMarkers.delete(id);
      }
    });

    // Add markers entering viewport
    this.allMarkers.forEach(markerData => {
      if (!this.visibleMarkers.has(markerData.id) &&
          paddedBounds.contains(markerData.coordinates)) {

        const marker = new mapboxgl.Marker()
          .setLngLat(markerData.coordinates)
          .addTo(this.map);

        this.visibleMarkers.set(markerData.id, marker);
      }
    });
  }

  addPadding(bounds, factor) {
    const sw = bounds.getSouthWest();
    const ne = bounds.getNorthEast();

    const latPadding = (ne.lat - sw.lat) * factor;
    const lngPadding = (ne.lng - sw.lng) * factor;

    return new mapboxgl.LngLatBounds(
      [sw.lng - lngPadding, sw.lat - latPadding],
      [ne.lng + lngPadding, ne.lat + latPadding]
    );
  }
}

// Initialize with viewport-based rendering
const markerManager = new MarkerManager(map, largeMarkerDataset);
map.on('moveend', () => markerManager.updateVisibleMarkers());
CORS and API Proxy Issues
Resolve cross-origin resource sharing challenges:
// Server-side proxy implementation (Node.js/Express)
app.get('/api/mapbox/geocoding', async (req, res) => {
  try {
    const { query } = req.query;
    const response = await fetch(
      `https://api.mapbox.com/geocoding/v5/mapbox.places/${encodeURIComponent(query)}.json?access_token=${MAPBOX_SECRET_TOKEN}`
    );

    const data = await response.json();
    res.json(data);
  } catch (error) {
    res.status(500).json({ error: 'Geocoding request failed' });
  }
});

// Client-side proxy usage
const geocodeWithProxy = async (query) => {
  try {
    const response = await fetch(`/api/mapbox/geocoding?query=${encodeURIComponent(query)}`);
    return await response.json();
  } catch (error) {
    console.error('Geocoding failed:', error);
    return null;
  }
};
Maintenance and Updates
Successful long-term integration requires ongoing maintenance and staying current with platform updates. Implementing proper maintenance practices ensures continued reliability and performance.
SDK Version Management
Stay current with Mapbox SDK releases while maintaining stability:
// Version compatibility checking
const checkSDKCompatibility = () => {
  const currentVersion = mapboxgl.version;
  const requiredVersion = '2.0.0';

  if (compareVersions(currentVersion, requiredVersion) < 0) {
    console.warn(`Mapbox GL JS version ${currentVersion} is outdated. Consider upgrading to ${requiredVersion} or later.`);
  }
};

// Graceful migration handling
const migrateFromLegacyAPI = () => {
  // Handle deprecated method calls
  if (typeof map.addControl === 'function') {
    // New API available
    map.addControl(new mapboxgl.NavigationControl());
  } else {
    // Fallback for older versions
    console.warn('Using legacy control API');
    // Implement legacy control addition
  }
};

// Feature detection for new capabilities
const detectNewFeatures = () => {
  const features = {
    terrain3D: 'setTerrain' in map,
    customLayers: 'addLayer' in map,
    clustering: true // Assume clustering is available
  };

  return features;
};
Performance Monitoring and Optimization
Implement continuous performance monitoring:
// Performance metrics collection
class MapPerformanceMonitor {
  constructor(map) {
    this.map = map;
    this.metrics = {
      loadTime: null,
      frameRate: [],
      memoryUsage: [],
      apiRequests: 0
    };

    this.initializeMonitoring();
  }

  initializeMonitoring() {
    // Track initial load time
    const startTime = performance.now();
    this.map.on('load', () => {
      this.metrics.loadTime = performance.now() - startTime;
      this.reportMetrics();
    });

    // Monitor frame rate
    this.startFrameRateMonitoring();

    // Track memory usage
    this.startMemoryMonitoring();
  }

  startFrameRateMonitoring() {
    let lastTime = performance.now();
    let frameCount = 0;

    const measureFrameRate = (currentTime) => {
      frameCount++;

      if (currentTime - lastTime >= 1000) {
        const fps = frameCount;
        this.metrics.frameRate.push(fps);

        if (this.metrics.frameRate.length > 60) {
          this.metrics.frameRate.shift();
        }

        frameCount = 0;
        lastTime = currentTime;

        // Alert on poor performance
        if (fps < 30) {
          console.warn(`Low frame rate detected: ${fps} FPS`);
        }
      }

      requestAnimationFrame(measureFrameRate);
    };

    requestAnimationFrame(measureFrameRate);
  }

  reportMetrics() {
    // Send metrics to analytics service
    if (typeof analytics !== 'undefined') {
      analytics.track('map_performance', this.metrics);
    }
  }
}
Automated Health Checks
Implement automated monitoring for production environments:
// Map health monitoring
class MapHealthChecker {
  constructor(map) {
    this.map = map;
    this.healthChecks = [];
    this.interval = 60000; // Check every minute

    this.initializeChecks();
  }

  initializeChecks() {
    this.addHealthCheck('map_loaded', () => this.map.loaded());
    this.addHealthCheck('tiles_loaded', () => this.checkTileStatus());
    this.addHealthCheck('api_responsive', () => this.checkAPIHealth());

    this.startMonitoring();
  }

  addHealthCheck(name, checkFunction) {
    this.healthChecks.push({ name, check: checkFunction });
  }

  async runHealthChecks() {
    const results = {};

    for (const { name, check } of this.healthChecks) {
      try {
        results[name] = await check();
      } catch (error) {
        results[name] = false;
        console.error(`Health check failed: ${name}`, error);
      }
    }

    return results;
  }

  startMonitoring() {
    setInterval(async () => {
      const health = await this.runHealthChecks();
      this.reportHealth(health);
    }, this.interval);
  }

  reportHealth(health) {
    const unhealthyChecks = Object.entries(health)
      .filter(([name, status]) => !status)
      .map(([name]) => name);

    if (unhealthyChecks.length > 0) {
      console.warn('Map health issues detected:', unhealthyChecks);
      // Trigger alerts or remediation
    }
  }
}
Documentation and Knowledge Management
Maintain comprehensive documentation for your integration:
// Self-documenting configuration
const MapConfig = {
  // Production configuration
  production: {
    accessToken: process.env.MAPBOX_ACCESS_TOKEN,
    style: 'mapbox://styles/your-org/production-style',
    center: [-74.006, 40.7128],
    zoom: 12,
    // Performance optimizations
    optimizeForTerrain: false,
    maxZoom: 18,
    minZoom: 8
  },

  // Development configuration
  development: {
    accessToken: process.env.MAPBOX_DEV_ACCESS_TOKEN,
    style: 'mapbox://styles/mapbox/streets-v11',
    center: [-74.006, 40.7128],
    zoom: 12,
    // Debug features enabled
    debug: true,
    showTileBoundaries: true
  },

  // Feature flags for gradual rollouts
  features: {
    enable3DTerrain: false,
    enableClustering: true,
    enableOfflineMode: false,
    useCustomMarkers: true
  }
};

// Usage documentation in code
/**
 * Initializes Mapbox integration with environment-specific configuration
 *
 * @param {string} environment - 'production' or 'development'
 * @param {Object} overrides - Configuration overrides
 * @returns {mapboxgl.Map} Configured map instance
 *
 * @example
 * const map = initializeMap('production', {
 *   center: [-118.2437, 34.0522], // Override to Los Angeles
 *   zoom: 10
 * });
 */
const initializeMap = (environment = 'production', overrides = {}) => {
  const config = { ...MapConfig[environment], ...overrides };

  return new mapboxgl.Map(config);
};
Final Thoughts
Successfully integrating Mapbox transforms applications from simple tools into engaging, location-aware experiences that users love. Throughout this comprehensive guide, we’ve explored every aspect of the integration process, from initial account setup through advanced customization and production deployment.
The key to successful mapbox integration lies in understanding your users’ specific needs and designing solutions that provide genuine value. Whether you’re creating a simple store locator or a complex real-time tracking system, Mapbox’s flexibility and comprehensive suite of tools enable unlimited possibilities.
Remember that mapbox maps are more than just visual elements—they’re interactive platforms that can drive user engagement, support business objectives, and provide critical functionality. The maps sdk provides the foundation, but your implementation determines the success.
Start with a simple integration to familiarize yourself with the core concepts, then gradually add advanced features as your requirements evolve. The mapbox studio provides powerful visual editing capabilities, while the extensive apis support everything from routing to geocoding to real-time data visualization.
Performance optimization, security considerations, and proper error handling separate professional implementations from basic prototypes. Implement these best practices from the beginning to avoid technical debt and ensure scalable solutions.
As you embark on your mapbox integration journey, leverage the extensive documentation, active developer community, and comprehensive support channels available. The investment in learning mapbox’s capabilities pays dividends through reduced development time, enhanced user experiences, and unlimited customization possibilities.
Transform your application today by implementing mapbox’s powerful mapping capabilities, and create location-aware experiences that engage users and drive business success.
Digital Transformation Strategy for Siemens Finance
Cloud-based platform for Siemens Financial Services in Poland


You may also like...

Mapbox vs Google Maps: Which Mapping Platform Is Better for Your App?
Choosing the right mapping platform can significantly impact your app’s success. Explore which option is the better fit for your project.
Alexander Stasiak
Nov 19, 2025・10 min read

Mapbox for Logistics: Among Top 5 Industries That Benefit Most from Mapbox Integration
Mapbox empowers industries like logistics, real estate, travel, and retail with scalable mapping solutions that enhance performance and customer satisfaction.
Alexander Stasiak
Oct 10, 2025・10 min read

Mapbox Enterprise Solutions: From API Integration to Custom Platforms
Integrating Mapbox into enterprise systems opens the door to interactive, scalable, and fully customizable mapping experiences. This guide reveals how developers can leverage Mapbox’s APIs, real-time data, and flexible pricing to enhance operational efficiency and deliver powerful geospatial solutions.
Alexander Stasiak
Oct 01, 2025・15 min read
Ready to centralize your know-how with AI?
Start a new chapter in knowledge management—where the AI Assistant becomes the central pillar of your digital support experience.
Book a free consultationWork with a team trusted by top-tier companies.